There is a meme for about everything today. Regardless of your social network of choice, sometimes-amusing graphics are everywhere. Why not use them to teach math?
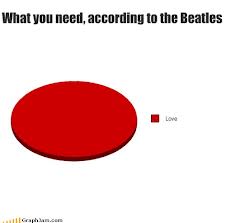
The font of all things meme, CHEEZburger, has a GraphJam section full of graph and diagram memes. Perhaps you are teaching pie charts. You could start with this.
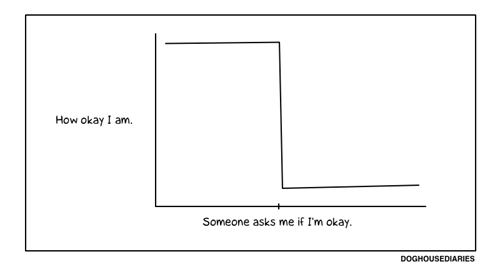
You might be teaching line graphs.
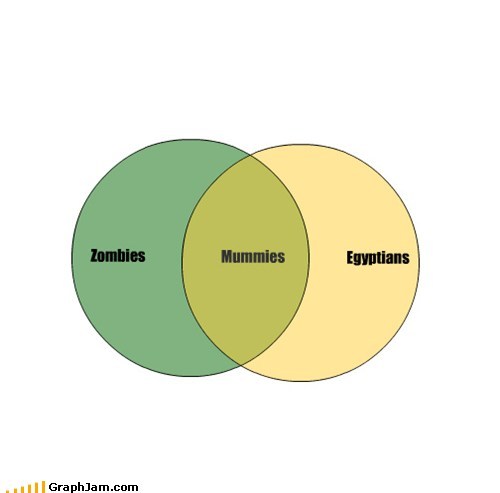
Venn Diagrams
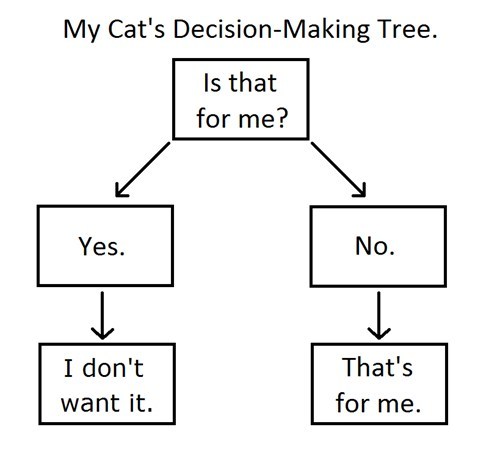
Or flow charts.
The “Trending Topics” pulldown at the top of GraphJam allows you to choose the type of graphic you want: bar graphs, line graphs, flow charts, etc. While everything on GraphJam is not school-appropriate, particularly for younger students, it can be a great source for conceptually-oriented graphics. Then, of course, your students can create them. Creating their own graphing meme—with mathematical explanation, of course—can be a motivating way to ensure that they understand the sense behind the graphs/charts.
Give it a try, then share. I’d be delighted to post the results!
